It is trite to say that data is power. But I did not realise that you can literally turn data into money (end sarcasm). Below, I have explained at a high level how a weekend project now provides a legitimate (i.e., non-insider) market edge to a prominent investment bank. With a little bit of code and ingenuity, this investment bank is able to keep its financial model up to date daily, instead of twice yearly. If this sounds like something you could use, please feel free to get in touch.
Background
Some time ago, a long-time friend was speaking to me in a general way about one of the challenges he faced in his job. He works in equity research for an investment bank. He explained to me that he has a financial model for a fashion retailer, and that a significant input into the model is the number of stores open at any one time. They were maintaining a list of open stores based on a variety of inputs. Principally, they were using numbers from the regular twice-yearly financial reports in February and August of each year. They also relied on following the LinkedIn profiles of regional managers around the world; conversations with management; news articles; and whatever other information sources they could find.
“Don’t they just have one of those store locater map things on their website?” was my immediate question. Sometimes I am not a good “supportive” listener….
“Yes, they do. But it’s not practical to look at the map every day counting shops!” Was his response, as I recall it.
I told him that I thought there might be a less pain-inducing way to get the job done. A few weekends later, we sat down and looked into it. I am not a web developer, but I did spend a fair chunk of my teenage years learning how computers talk to each other. With a little bit of experimentation, we were able to find the raw store data and exploit it.
Method
I found that the way the map on the website works is as follows:
- The web page with the map contains an embedded application which is capable of rendering locations on a map, when fed data in a known format.
- Once the webpage loads, a request is made to a server for a data payload which contains a list of all the shops.
- The server provides the store data, which is then rendered by the map application dynamically as the user scrolls and filters.
I was able to capture and emulate the map data request which was normally made by the webpage, and the server provided me a raw copy of the data. We were on to something.
I won’t disclose the specific entity that we worked on. But I’ve done something similar for illustrative purposes with McDonald’s “restaurant” data. Here is the data for a McDonald’s “Restaurant” near me, which the “restaurant” chain in question provides when you send the right request:
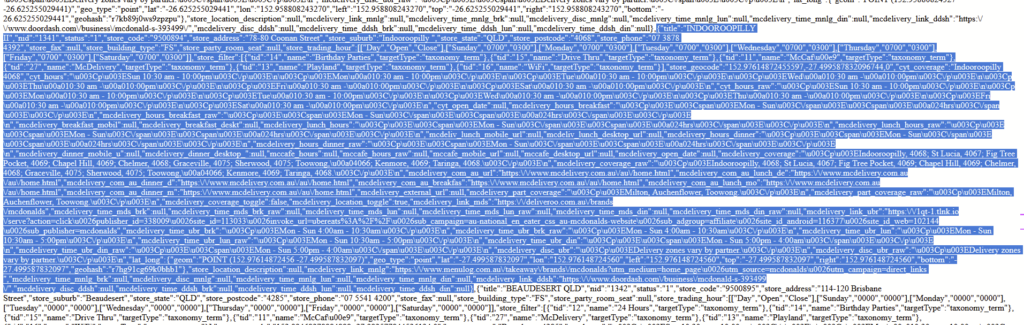
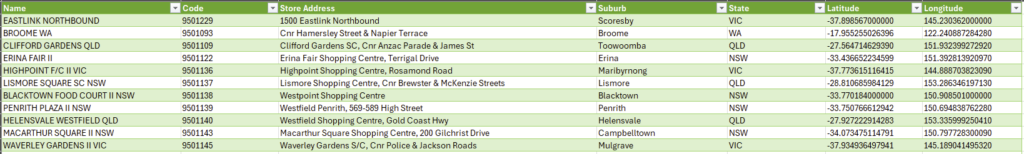
This data can be consumed by a number of computer programs. I built some tooling to extract the data which was relevant for the model. I included some other material just because I thought it might be useful one day. To continue with the McDonald’s example, here’s roughly what the output looked like.
Value
This data is always up to date, and is directly consumable by the financial model used by my friend. The result is:
- The firm is able to update their earning estimates and price target for the retailer in question more frequently than competing firms.
- The firm is able to predict whether the retailer is likely to meet or exceed earnings expectations, which provides the firm’s customers an edge in trading.
- The firm’s juniors do not have to spend time every week looking for information about new stores.
- The quality of the data available can be used to derive new insights about the performance of the business. For example, a count of the stores in particular areas can be readily performed: I can tell you for a fact that at the time of writing, there are 21 suburbs in Australia with exactly 3 McDonald’s “restaurants”.
If you want to unlock publicly available data in a similar fashion, feel free to get in touch.